How to analyze a gold (XAUUSD) chart with AI
Take a screenshot of your gold (XAUUSD) chart — from MetaTrader, TradingView or your broker's app — and upload it to an AI chart analysis app such as Wick. In a few seconds it returns the trend, key support and resistance, the chart pattern, bullish and bearish scenarios with probabilities, and an example trade plan. Treat it as a structured second opinion to check against your own read.
What you need
A clear screenshot of the gold chart you are looking at, and an AI chart analysis app. This guide uses Wick, an iPhone app that analyzes chart screenshots. No account is needed.
- Any platform: MetaTrader 4 or 5, TradingView, a broker app, or a photo of your screen
- Any timeframe, from 1-minute charts to daily and weekly charts
- Candlestick, bar or line charts
Step by step
- Open your gold chart on the timeframe you trade, and zoom so that recent price action and the price axis are both visible.
- Keep the indicators you normally use, such as moving averages or Bollinger Bands. Wick lists the ones it can see and takes them into account.
- Take a screenshot, or photograph your screen, and upload it in Wick from your photo library or the camera.
- Read the report in order: the overview, then the scenarios, the strategy and the key levels.
A real example: gold on the 5-minute chart
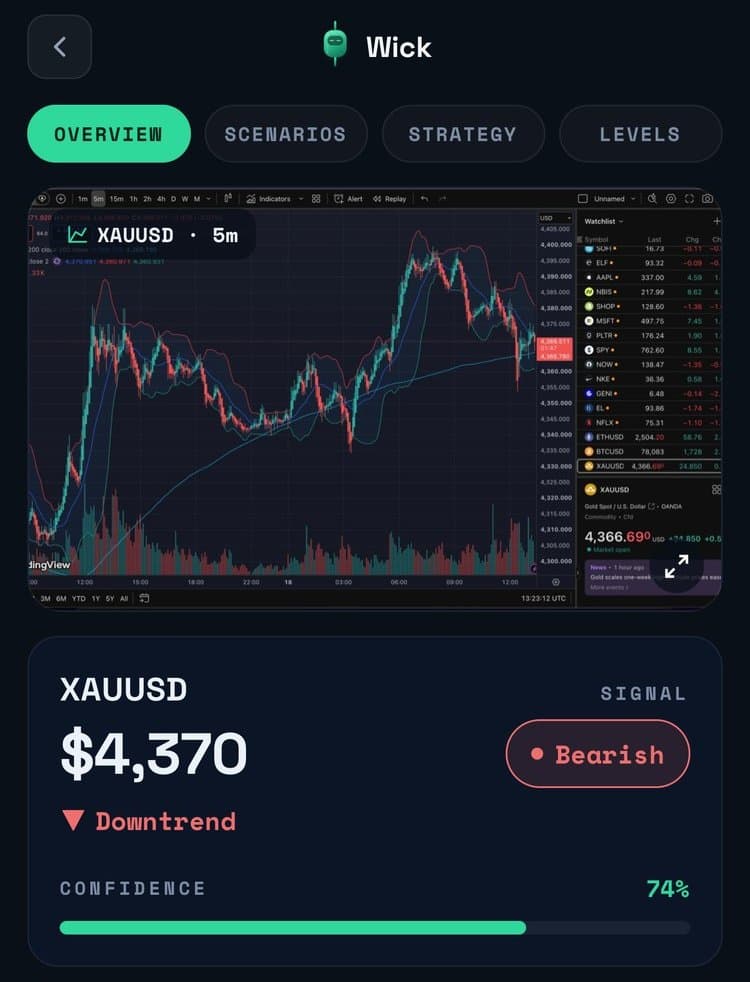
This is the analysis Wick returned for a TradingView screenshot of XAUUSD on the 5-minute timeframe, with Bollinger Bands and a 200-period moving average on the chart. Wick read the ticker, the timeframe and the price ($4,370) from the image itself.
Key levels and the chart pattern
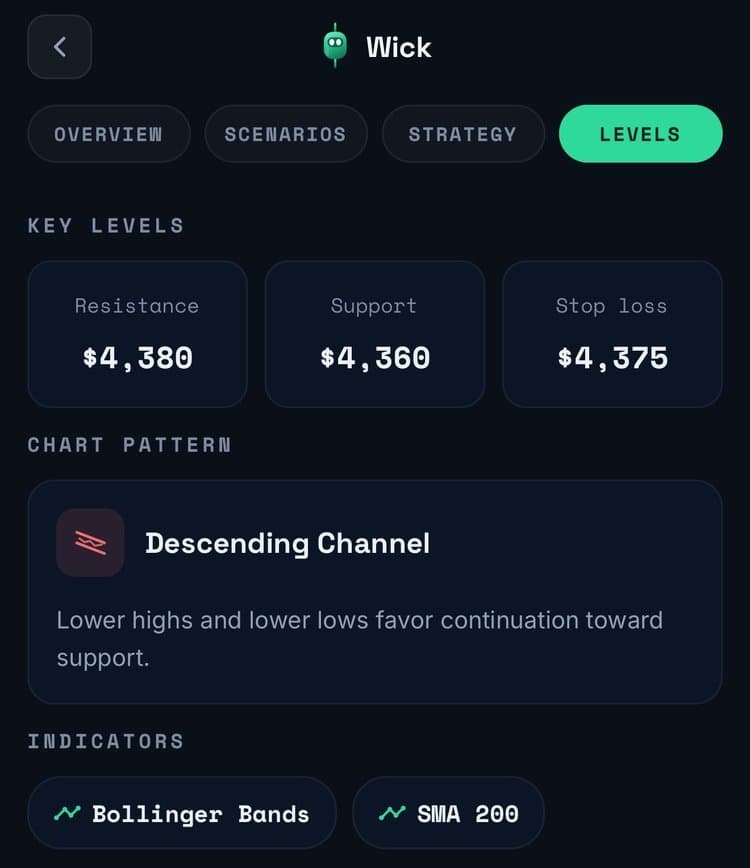
Wick marked resistance at $4,380 and support at $4,360, and identified a descending channel: a series of lower highs and lower lows that, while it holds, favors a move toward support. It also listed the indicators it found on the chart.
Both scenarios, with probabilities
Instead of a single call, Wick gives both sides. Here it weighed the bearish case at 62%: a break below $4,360 could extend the decline toward $4,337. The bullish case, at 38%, needed a sustained break above $4,380 to retest $4,395. Each case has its own entry, target, stop and risk-reward ratio.
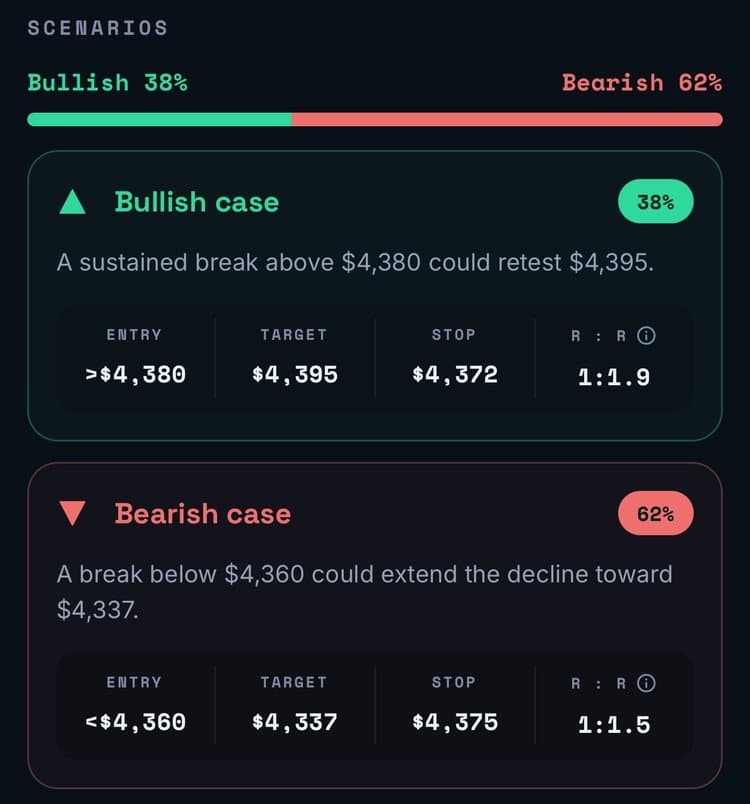
The probabilities are rough estimates, not certainties. A case only becomes relevant once price does what its entry describes.
Tips for gold charts
- Gold is priced in dollars, so levels read as prices such as $4,360 rather than pips.
- Gold can move sharply around major US economic releases. A screenshot cannot show the news calendar, so check it before relying on a short-timeframe setup.
- The analysis reflects the chart at the moment of the screenshot. If price has moved on, take a new screenshot.
- Compare timeframes. A bearish 5-minute setup can sit inside a bullish daily trend, and analyzing both gives you context.
Frequently asked questions
Can AI analyze a gold chart?
Yes. An AI chart analysis app such as Wick reads a screenshot of an XAUUSD chart and returns the trend, support and resistance, the chart pattern, bullish and bearish scenarios and an example trade plan. It is educational analysis, not financial advice.
Which timeframe should I use for gold?
Use the timeframe you actually trade. Wick works on any timeframe, from 1-minute to weekly charts. Many traders check a higher timeframe first for context, then their trading timeframe for the setup.
Does it work with MetaTrader gold charts?
Yes. Screenshots from MetaTrader 4 and 5, TradingView and broker apps all work, as does a photo of your screen. Keep the price axis in the picture so the levels can be read accurately.
Is the AI analysis always right?
No. Any analysis, human or AI, can be wrong, and gold can move sharply on news that a chart does not show. Check the levels against your own read and make your own decisions.
Educational content, not financial advice. Trading involves risk, including the loss of your capital. AI analysis can be wrong; always do your own research. Read the full disclaimer.