What is a descending channel? How to read it on a chart
A descending channel is a chart pattern in which price makes lower highs and lower lows between two parallel, downward-sloping lines. The upper line acts as resistance and the lower line as support. While price stays inside the channel the bias is bearish; a decisive close above the upper line is the first sign that the pattern may be ending.
How to draw a descending channel
- Find at least two lower highs and connect them with a straight line. This is the upper line, or resistance.
- Draw a parallel line through the lows between them. It should touch at least two lower lows. This is the lower line, or support.
- Check that price respects both lines. If candles keep closing well outside them, it is not a clean channel.
What it tells you
Each rally fails at a lower price than the one before, and each drop reaches a new low: sellers are in control. As long as that rhythm holds, the channel favors moves back toward the lower line, which is why it is usually read as a bearish continuation pattern.
How traders use it
- Inside the channel: rallies toward the upper line are watched as possible short entries, with targets near the lower line.
- Breakdown: a close below the lower line can mean the decline is speeding up.
- Breakout: a close above the upper line, ideally followed by a successful retest, is the first sign the downtrend may be over.
- Whatever the setup, the stop goes beyond the line that would prove it wrong.
Descending channel, falling wedge or bull flag?
- Descending channel: two parallel lines sloping down. Bearish while price stays inside.
- Falling wedge: both lines slope down but converge, as each drop gets smaller. Traditionally read as a bullish reversal pattern.
- Bull flag: a short descending channel right after a sharp rise. Traditionally read as a pause before the rise continues.
The same shape can mean different things depending on what came before it, so always check the larger trend.
A real example on gold
On this 5-minute XAUUSD chart, Wick detected a descending channel: lower highs and lower lows that favor continuation toward support. It marked resistance at $4,380 and support at $4,360.
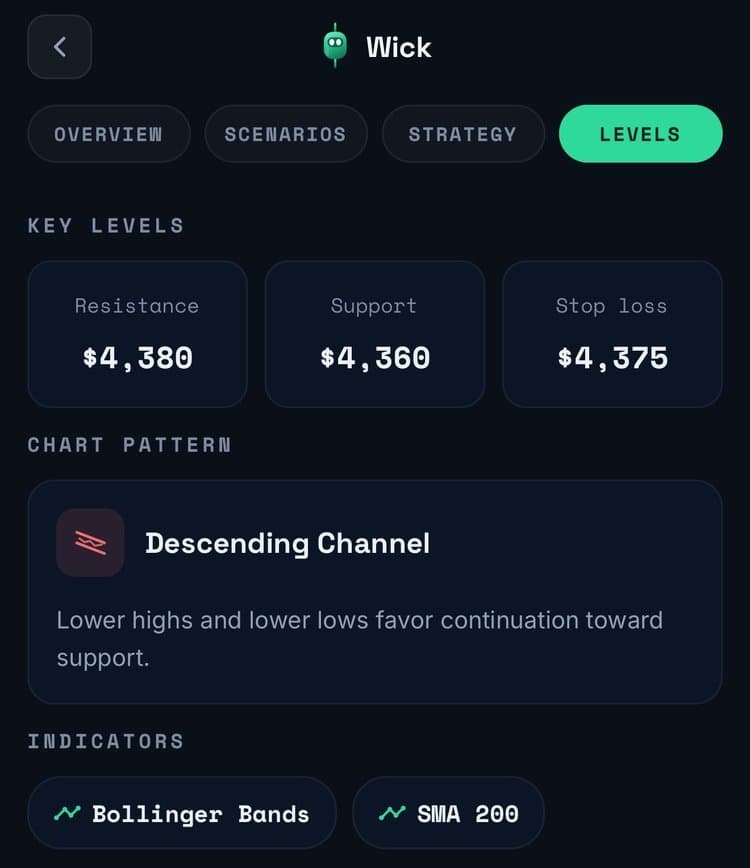
Because the channel pointed down, Wick gave the bearish case the higher probability, 62%, with a short plan below $4,360, a stop above $4,375 and a target of $4,337. The full walkthrough is in the gold chart guide.
Common mistakes
- Drawing a channel from one high and one low. Two touches on each line is the minimum.
- Forcing the lines. If you have to bend the rules to make it fit, the channel probably is not there.
- Acting on a breakout before the candle closes. Wicks poke through channel lines all the time.
- Ignoring the larger trend. A descending channel on the 5-minute chart can be a small pullback on the daily chart.
Frequently asked questions
Is a descending channel bullish or bearish?
Bearish while price stays inside it, because each high and low is lower than the last. A close above the upper line can signal a reversal, and a short descending channel after a strong rise is often read as a bull flag.
What is the difference between a descending channel and a falling wedge?
In a descending channel the two lines are parallel. In a falling wedge they converge as the drops get smaller, and the pattern is traditionally read as bullish.
How do you confirm a breakout from a descending channel?
Wait for a candle to close beyond the line on your timeframe. Many traders also wait for a retest of the broken line, and look for rising volume.
Can AI detect a descending channel?
Yes. Wick names the chart pattern it finds in a screenshot, such as a descending channel, and explains what it implies for that chart, alongside the key levels and scenarios.
Educational content, not financial advice. Trading involves risk, including the loss of your capital. AI analysis can be wrong; always do your own research. Read the full disclaimer.