How to analyze a EUR/USD chart with AI
Take a screenshot of your EUR/USD chart — from MetaTrader 4 or 5, TradingView or your broker's app — and upload it to an AI chart analysis app such as Wick. It reads the candles, the price axis and any visible indicators, and returns the trend, key levels in pips, bullish and bearish scenarios with probabilities and an example trade plan. Use it as a second opinion, and check the economic calendar before acting on it.
What makes forex charts different
- Prices move in pips. On EUR/USD a pip is the fourth decimal, 0.0001, so a move from 1.1180 to 1.1135 is 45 pips. Wick writes forex levels at this precision, without a currency sign.
- The market runs 24 hours a day from Monday to Friday, through the Asian, London and New York sessions. The London–New York overlap is usually the most active time for EUR/USD.
- Central bank decisions from the ECB and the Fed, and US data such as the monthly jobs report, can move EUR/USD sharply within minutes.
- There is no single exchange, so prices differ slightly between brokers. The volume on a MetaTrader chart is tick volume: a count of price changes, not traded size.
Step by step
- Open EUR/USD in MetaTrader, TradingView or your broker's app, on the timeframe you trade.
- Make sure the price axis and the symbol and timeframe label are visible, along with any moving averages or other indicators you use.
- Take a screenshot and upload it in Wick. On a phone, turning MetaTrader sideways first fits more candles into the picture.
- Read the report in order: the overview, then the scenarios, the strategy and the key levels.
A real example: EUR/USD on the 1-hour chart
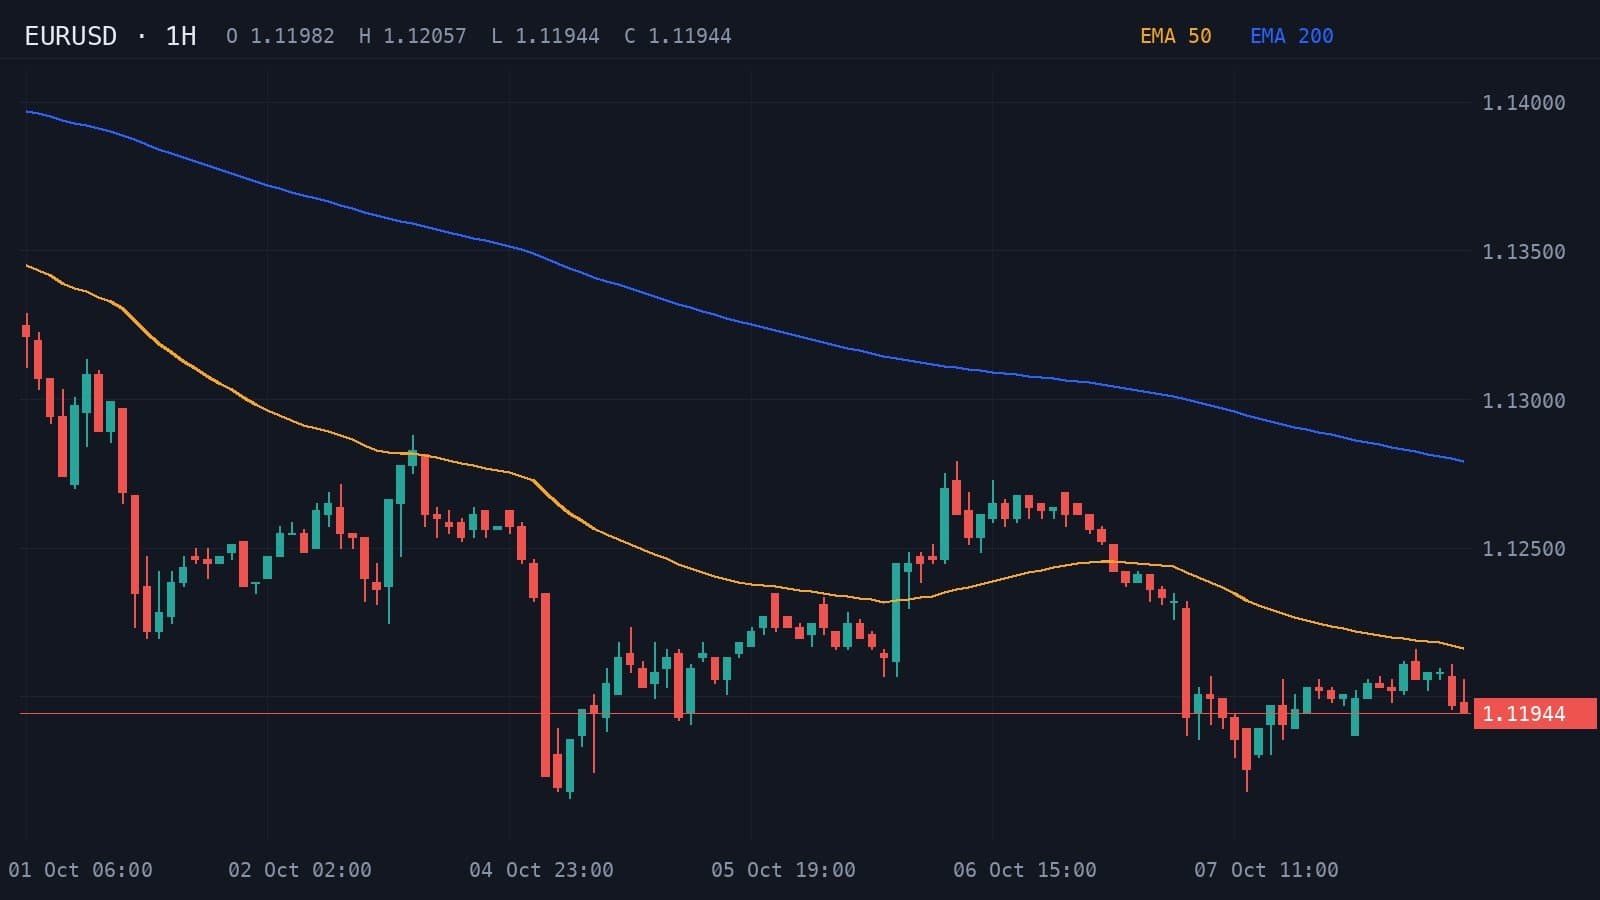
This is a 1-hour EUR/USD chart from 8 October 2026, with the 50- and 200-period EMAs, and the analysis Wick returned for it.
- Resistance
- 1.1215
- Support
- 1.1180
- Stop loss
- 1.1200
Lower highs below declining EMAs favor further downside if 1.1180 support breaks.
Indicators: EMA 50, EMA 200
A sustained break above 1.1215 could target 1.1250 after reclaiming short-term resistance.
- Entry
- >1.1215
- Target
- 1.1250
- Stop
- 1.1195
- R:R
- 1:1.8
A close below 1.1180 may extend the markdown toward 1.1135.
- Entry
- <1.1180
- Target
- 1.1135
- Stop
- 1.1200
- R:R
- 1:2.3
- Trigger
- 1H close below 1.1180
- Entry
- Failed retest near 1.1180
- Stop
- Above 1.1200
- Target
- 1.1135
How to read this result
Price is below both EMAs, and the EMA 50 is below the EMA 200: a clear short-term downtrend. Wick named the pattern a bearish continuation, weighed the bearish case at 71% and rated its confidence at 78%.
The plan waits for a 1-hour close below 1.1180, enters on a failed retest of that level, places the stop above 1.1200 and targets 1.1135. That is 20 pips of risk for 45 pips of reward, about 1:2.3. The bullish case needs a sustained break above 1.1215, with a stop at 1.1195 and a target of 1.1250: 20 pips of risk for 35 of reward, about 1:1.8.
With price at 1.11944, between support and resistance, neither plan is active yet.
Tips for EUR/USD charts
- Check the economic calendar before relying on a short-timeframe setup. A scheduled release can break any level.
- Spreads often widen around the daily rollover at 5 pm New York time and in quiet hours, which can trigger stops placed close to price.
- Compare timeframes. A bearish 1-hour setup can sit inside a bullish daily trend.
- The analysis reflects the chart at the moment of the screenshot. If price has moved on, take a new one.
Frequently asked questions
Can AI analyze forex charts?
Yes. Wick reads screenshots of forex charts, including EUR/USD and the other major pairs, and returns the trend, key levels in pips, bullish and bearish scenarios and an example trade plan. It is educational analysis, not financial advice.
Does it work with MetaTrader 4 and 5?
Yes. Take a screenshot in MetaTrader 4 or 5, on desktop or mobile, and upload it. TradingView and broker apps work too.
Why are the levels written without a dollar sign?
Forex prices are exchange rates, not dollar amounts. Wick writes them at pip precision, such as 1.1180, the way they appear on a forex chart.
What is a pip on EUR/USD?
A pip is 0.0001, the fourth decimal place, so a move from 1.1200 to 1.1180 is 20 pips. On yen pairs such as USD/JPY, a pip is the second decimal, 0.01.
Educational content, not financial advice. Trading involves risk, including the loss of your capital. AI analysis can be wrong; always do your own research. Read the full disclaimer.