How to analyze a Bitcoin (BTC) chart with AI
Take a screenshot of your Bitcoin chart — from TradingView, your exchange or a broker app — and upload it to an AI chart analysis app such as Wick. In a few seconds it returns the trend, key support and resistance, the chart pattern, bullish and bearish scenarios with probabilities, and an example trade plan. Bitcoin trades around the clock, so treat the result as a second opinion on the chart as it looked when you took the screenshot.
What makes Bitcoin charts different
- Bitcoin trades 24 hours a day, 7 days a week, so there are no overnight or weekend gaps. On most crypto charts the daily candle closes at 00:00 UTC.
- Moves are large in dollar terms. Key levels are often round numbers such as $80,000, and a few hundred dollars is ordinary noise on short timeframes.
- Prices differ slightly between exchanges and pairs. BTCUSD and BTCUSDT can show different highs and lows, so analyze the chart you actually trade.
- On weekly and monthly charts, a logarithmic price scale shows Bitcoin's long-term moves in proportion. On intraday charts the normal scale is fine.
Step by step
- Open the Bitcoin chart you trade on your usual timeframe, and make sure recent candles and the price axis are both visible.
- Keep the indicators you rely on, such as moving averages. Wick lists the ones it can see and takes them into account.
- Take a screenshot, or photograph your screen, and upload it in Wick from your photo library or the camera.
- Read the report in order: the overview, then the scenarios, the strategy and the key levels.
A real example: Bitcoin on the 4-hour chart
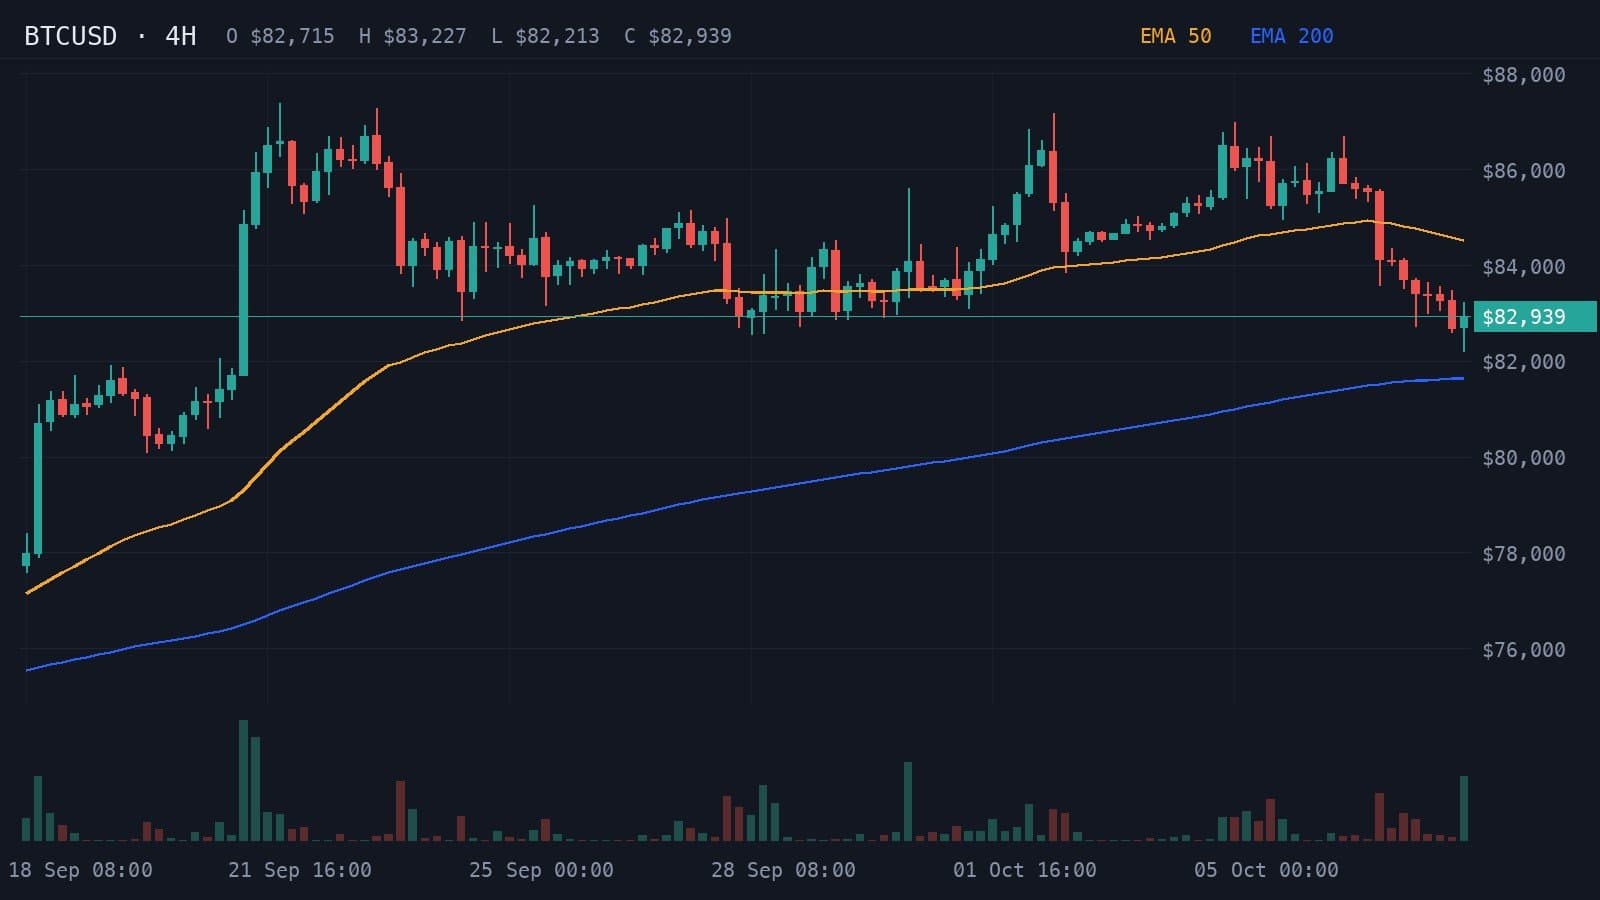
This is a 4-hour BTCUSD chart from 8 October 2026, with the 50- and 200-period EMAs, and the analysis Wick returned for it.
- Resistance
- $84,000
- Support
- $82,000
- Stop loss
- $83,300
Price is making lower highs below the EMA 50, favoring continuation toward support.
Indicators: EMA 50, EMA 200
A reclaim above $84,000 could target $86,000, invalidating the immediate bearish structure.
- Entry
- >$84,000
- Target
- $86,000
- Stop
- $83,200
- R:R
- 1:2.5
A break below $82,000 could extend the decline toward $80,000 near the next structural support.
- Entry
- <$82,000
- Target
- $80,000
- Stop
- $83,300
- R:R
- 1:1.5
- Trigger
- 4H close below $82,000
- Entry
- Failed retest near $82,000
- Stop
- Above $83,300
- Target
- $80,000
How to read this result
Wick called the 4-hour trend down and named the pattern a bearish pullback: price is making lower highs below the EMA 50. The wider picture on the same chart matters too. Price is still above the EMA 200 after the sharp rise around 21 September, which is why the bullish case still gets 42%.
The plan follows the bearish case. The trigger is a 4-hour close below $82,000, the entry a failed retest of that level from below, the stop above $83,300 and the target $80,000. That risks $1,300 to make $2,000, about 1:1.5. The bullish alternative, a reclaim of $84,000 toward $86,000 with a stop at $83,200, risks $800 to make $2,000, about 1:2.5.
With price at $82,939, between support and resistance, neither plan is active yet. Each one only applies once its trigger happens.
Tips for Bitcoin charts
- Liquidity is often thinner at weekends, so weekend breakouts can be less reliable.
- Weigh levels by timeframe. Support on a 5-minute chart matters far less than support on the daily chart.
- US economic data and regulatory headlines can move Bitcoin sharply, and a chart cannot show them coming.
- The analysis reflects the chart at the moment of the screenshot. Bitcoin never closes, so take a new screenshot if price has moved.
Frequently asked questions
Can AI analyze a Bitcoin chart?
Yes. An AI chart analysis app such as Wick reads a screenshot of a BTC chart and returns the trend, support and resistance, the chart pattern, bullish and bearish scenarios with probabilities and an example trade plan. It is educational analysis, not financial advice.
Can AI predict the price of Bitcoin?
No. It reads the structure of the chart and gives conditional scenarios, such as a break below $82,000 extending toward $80,000, with rough probabilities. Nobody can reliably predict where Bitcoin will trade.
Does it work with exchange and TradingView screenshots?
Yes. Screenshots from TradingView, crypto exchanges and broker apps all work, as does a photo of your screen. Keep the price axis visible so the levels are read correctly.
Which timeframe should I use for Bitcoin?
The one you trade. Wick works on any timeframe. Swing traders often start from the daily or 4-hour chart, day traders from the 1-hour or 15-minute chart.
Educational content, not financial advice. Trading involves risk, including the loss of your capital. AI analysis can be wrong; always do your own research. Read the full disclaimer.