How to analyze a crude oil (WTI) chart with AI
Upload a screenshot of your WTI or Brent chart (USOIL or UKOIL on most CFD platforms) to an AI chart analysis app such as Wick. It reads the price in dollars per barrel, marks support and resistance to the cent, names the chart pattern and sets out a bullish and a bearish case, each with a probability and an example plan. Oil can jump on the weekly inventory report and on OPEC+ news, so check the calendar before acting on a short-term setup.
What makes oil charts different
- There are two benchmarks. WTI is US crude and Brent is the international benchmark; on CFD platforms they often appear as USOIL and UKOIL. They move together but not in lockstep, so analyze the one you trade.
- Oil is quoted in dollars per barrel, to the cent. On a standard WTI futures contract of 1,000 barrels, each $0.01 move is worth $10; on CFD platforms the value depends on your broker's contract size.
- Scheduled news moves it. The weekly US inventory report from the EIA, usually on Wednesday at 10:30 a.m. New York time, and OPEC+ production decisions can push price through key levels in minutes.
- Futures contracts expire every month. A continuous futures chart can show a jump when one contract rolls into the next, and CFD prices are adjusted around the same time, so a sudden gap is not always a real move.
New to AI chart analysis?
Check that the symbol label shows which benchmark you are looking at before you take the screenshot. Everything else, from capturing the chart to reading the report, is covered in the main guide.
- How to analyze a trading chart with AIHow AI chart analysis works: screenshot any trading chart, upload it, and read the trend, key levels, both scenarios and a trade plan. With real examples.
A real example: WTI crude on the 1-hour chart
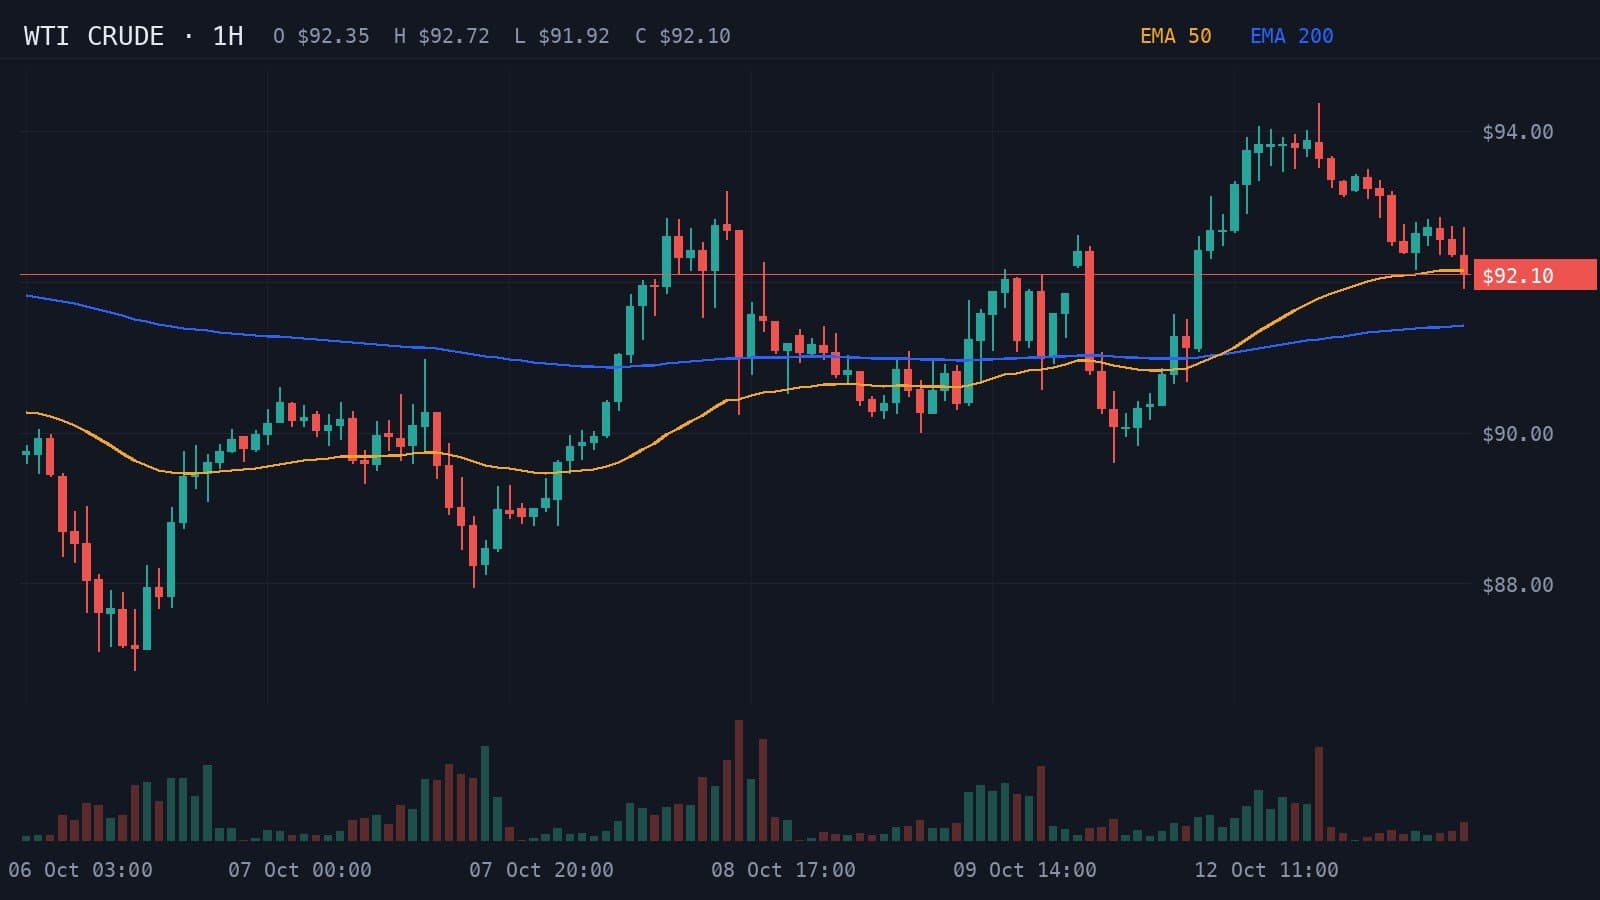
Below is a 1-hour WTI crude chart from 13 October 2026, plotted with its 50- and 200-period EMAs, followed by Wick's read of it.
- Resistance
- $92.70
- Support
- $91.80
- Stop loss
- $92.20
Price is retracing toward the rising EMA 50 after a strong advance, keeping the broader structure bullish.
Indicators: EMA 50, EMA 200
A sustained break above $92.70 could reopen the recent high near $94.
- Entry
- >$92.70
- Target
- $94.00
- Stop
- $92.20
- R:R
- 1:2.6
A break below $91.80 would weaken the structure and expose the $90.80 area.
- Entry
- <$91.80
- Target
- $90.80
- Stop
- $92.30
- R:R
- 1:2
- Trigger
- 1H close above $92.70
- Entry
- Successful retest near $92.70
- Stop
- Below $92.20
- Target
- $94
How to read this result
Oil had climbed from below $87 to a high of $94.36 and was pulling back toward the rising EMA 50, which sat above the EMA 200. Wick called the trend up, named the pattern a bullish pullback and gave the bullish case 56%: a lean, not a strong conviction.
The plan follows the bullish case. It waits for a 1-hour close above $92.70, enters on a successful retest of that level, places the stop below $92.20 and targets $94.00. That risks $0.50 a barrel to make $1.30, about 1:2.6. The bearish case needs a break below $91.80, with a stop at $92.30 and a target of $90.80: $0.50 of risk for $1.00 of reward, 1:2.
At $92.10, price was between support and resistance, so neither plan was active yet. Volume was decreasing during the pullback.
Tips for oil charts
- Check the calendar for the weekly inventory report and OPEC+ meetings before relying on a short-timeframe setup.
- The American Petroleum Institute publishes its own inventory estimate on Tuesday afternoons, so oil often reacts a day before the official EIA figures.
- Watch for gaps at contract rolls and at the Sunday open, and do not read them as normal price action.
- Oil moves the currencies of big producers too. A sharp oil move often shows up in USD/CAD, as the Canadian dollar tends to strengthen when oil rises.
Frequently asked questions
Can AI analyze an oil chart?
Yes. Wick reads WTI and Brent charts, USOIL and UKOIL included, and returns levels to the cent, the chart pattern, a bullish and a bearish case and an example plan. Treat it as a second opinion, not as financial advice.
Should I analyze WTI or Brent?
The one you trade. They track each other closely but can diverge, so levels from a WTI chart do not transfer exactly to Brent.
Why does my oil chart show a sudden gap?
Usually because the market reopened after the weekend, or because the chart switched from one monthly futures contract to the next. Neither is a normal move, so levels drawn across the gap need care.
When does oil move the most?
Often around the weekly US inventory report, usually on Wednesday at 10:30 a.m. New York time, around OPEC+ decisions, and on geopolitical news from oil-producing regions.
Educational content, not financial advice. Trading involves risk, including the loss of your capital. AI analysis can be wrong; always do your own research. Read the full disclaimer.