How to analyze a trading chart with AI
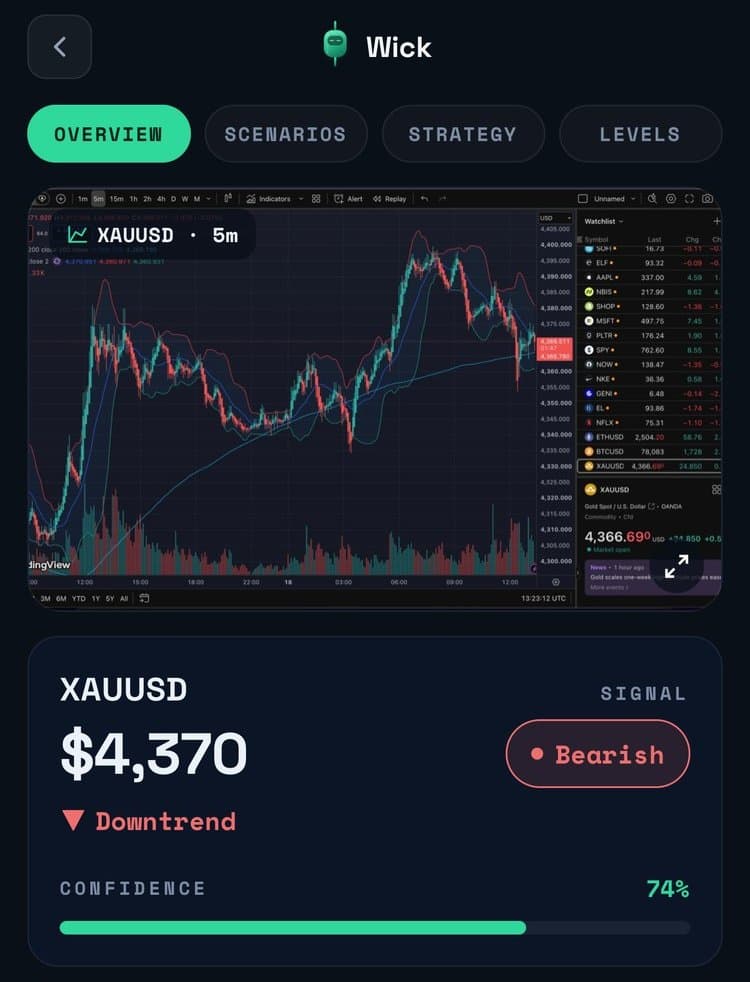
To analyze a trading chart with AI, take a screenshot of the chart — from MetaTrader, TradingView, a broker or an exchange — and upload it to an AI chart analysis app such as Wick. The AI reads the candles, the price axis and any visible indicators, and returns a structured report: the trend, key support and resistance, the chart pattern, bullish and bearish scenarios with probabilities, and an example trade plan with entry, stop loss and target. It works for stocks, indices, crypto, forex, gold and oil, on any timeframe.
What AI chart analysis is
AI chart analysis uses a vision model, an AI that can read images, to interpret a price chart the way a technical analyst would. Instead of drawing lines and checking indicators by hand, you get the structure of the chart laid out in a fixed, repeatable format.
It is not a price prediction and not a signal service. A useful analysis tells you what the chart shows, what would confirm each direction, and where each idea would be proven wrong, so that you make the decision.
Step by step
- Open the chart you want to analyze, on the timeframe you trade.
- Make sure the candles, the price axis and the symbol and timeframe label are visible. Keep the indicators you rely on.
- Take a screenshot, or photograph your screen.
- Upload it to Wick from your photo library or the camera.
- Read the report in order: the overview, then the scenarios, the strategy and the key levels.
What the report contains
- Overview: the instrument, the price, the trend, an overall signal with a confidence score, plus volume, market phase, momentum and risk level.
- Scenarios: a bullish and a bearish case, each with a probability, an entry, a target, a stop and the risk-reward ratio.
- Strategy: the recommended approach as a plan, with the trigger to wait for, the entry, the stop and the target.
- Key levels: support, resistance and the stop, the detected chart pattern, and the indicators visible on the chart.
How to read the result
- Start with the signal and the confidence, but read on. A 62% bearish case still leaves a 38% bullish one.
- Check what has to happen first. Each scenario only applies once its trigger fires; until then, price is simply between levels.
- Look at the risk-reward ratio. It tells you how much a plan aims to make for each unit it risks.
- Compare timeframes. A setup on the 5-minute chart can run against the trend on the daily chart.
Getting a good result
- Show the whole chart: the price axis on the right, the time axis at the bottom and enough history for the trend to be clear.
- Use a sharp image. A cropped axis or a blurry photo gives a weaker read.
- The analysis reflects the chart at the moment of the screenshot. Take a new one when price moves on.
- Treat probabilities as estimates, and the result as a second opinion to check against your own read.
Guides by market
Each market has its own habits. These guides walk through a real Wick analysis in each one.
- How to analyze a gold (XAUUSD) chart with AIScreenshot your XAUUSD chart, upload it to an AI chart analysis app, and read the trend, key levels, scenarios and trade plan it returns. A real example.
- How to analyze a crude oil (WTI) chart with AIScreenshot your crude oil chart (WTI, USOIL or Brent), upload it to an AI chart app, and read the levels, scenarios and plan. A real 1-hour WTI example.
- How to analyze a Bitcoin (BTC) chart with AIScreenshot your Bitcoin chart, upload it to an AI chart analysis app, and read the trend, levels, scenarios and trade plan. A real 4-hour BTCUSD example.
- How to analyze a EUR/USD chart with AIScreenshot your EUR/USD chart from MetaTrader or TradingView, upload it to an AI chart app, and read levels in pips. A real 1-hour example with a trade plan.
Reading charts and plans
- Can AI read a MetaTrader or TradingView screenshot?Yes. What an AI chart app reads from a MetaTrader or TradingView screenshot, how to take one it reads well, and what the analysis gives you back.
- Entry, stop loss and target: how to read a trade planWhat the trigger, entry, stop loss, target and risk-reward ratio mean in a trade plan, with a worked gold example and the arithmetic behind 1:1.5.
- What is a descending channel? How to read it on a chartA descending channel is a run of lower highs and lower lows between two parallel lines. How to draw it, read it and trade around it, with a real gold example.
Frequently asked questions
What is AI chart analysis?
It is the use of an AI that can read images to interpret a trading chart screenshot: the trend, support and resistance, chart patterns, indicators, and scenarios for what price could do next. Wick returns it as a structured report with an example trade plan.
Can AI predict where the market goes next?
No. It reads the structure of the chart and gives conditional scenarios with rough probabilities. Markets can move on news that a chart does not show, so treat the analysis as a second opinion.
Which charts can AI analyze?
Candlestick, bar and line charts from any platform and on any timeframe: stocks, indices, crypto, forex, gold and oil. Screenshots from MetaTrader, TradingView and broker apps all work, as does a photo of your screen.
Is AI chart analysis financial advice?
No. Wick provides educational and informational analysis only. It is not a broker, and nothing in it is a recommendation to buy or sell.
Educational content, not financial advice. Trading involves risk, including the loss of your capital. AI analysis can be wrong; always do your own research. Read the full disclaimer.