
Best ChatGPT prompts for stock trading and analysis
The best ChatGPT prompt for stock trading pairs a screenshot of the stock's chart with a fixed checklist: the price read from the axis, where the stock sits against its 50- and 200-day averages, support and resistance, the next earnings date, a long and a short setup with trigger, entry, stop and target, and the number of shares that fits your risk. The prompts below cover a chart read, an earnings check, a fundamental snapshot, day trading, position size and a trade review, ready to copy. To get the chart part without typing anything, Wick reads a stock screenshot in seconds and returns the levels, both scenarios with their odds and a plan from trigger to target.
What a stock prompt has to cover
A generic chart prompt treats a stock like any other market. Stocks have their own traps:
- Earnings. A quarterly report can move a stock 10% or more overnight, straight past every level on the chart.
- Gaps. Stocks trade in set hours, so the open can land far from the previous close, and a stop order fills at the first price available.
- The 50- and 200-day averages. Funds and traders watch them closely, so they often act as support or resistance.
- Volume. A breakout on heavy volume carries far more weight than one on a quiet afternoon.
- The market. Most stocks move with the S&P 500 and the Nasdaq, and a strong chart in a falling market often fails.
- Shares, not lots. Your size is a whole number of shares, worked out from the distance to your stop.
- ChatGPT prompts for trading chart and technical analysisCopy-ready ChatGPT prompts to analyze a trading chart screenshot: trend, key levels, patterns, both scenarios and a trade plan, plus how to check the answer.
Have two numbers ready before you start: your account size and the share of it you risk on one trade. The screenshot basics, such as keeping the price axis in view, are on the general ChatGPT chart prompts page.
Prompt 1: the stock chart read
Attach a screenshot of the stock's chart and paste this in. Replace the brackets, or remove them and let ChatGPT work them out from the image.
You are a swing trader who trades US stocks. The screenshot shows [TICKER] on the [daily] chart.

1. Tell me the ticker, the timeframe and the last price you can read on the chart. If one of them is not legible, say so and don't make it up.
2. Is the stock above or below its 50-day and 200-day moving averages, and which way is each one pointing?
3. Give me the support and resistance levels that matter, as prices from the right-hand axis, and point out any gap that hasn't been filled.
4. Were the big moves of the last few weeks on heavy or light volume?
5. Write a long setup and a short setup. For each: the daily close that triggers it, the entry, the stop, the target, the dollars at risk per share and the reward-to-risk ratio.
6. Which setup does the chart favor, and roughly how likely is each one?
7. If you can browse, find the next earnings date and tell me whether it falls inside the expected life of either trade.

Use only what you can see or look up, and keep it short.
Step 2 is the stock check that generic prompts skip. Step 5 asks for the risk per share, which Prompt 5 turns into a share count. Step 7 needs web search switched on; without it, find the date on the company's investor relations page.
A real stock read: Palantir (PLTR) on the daily chart
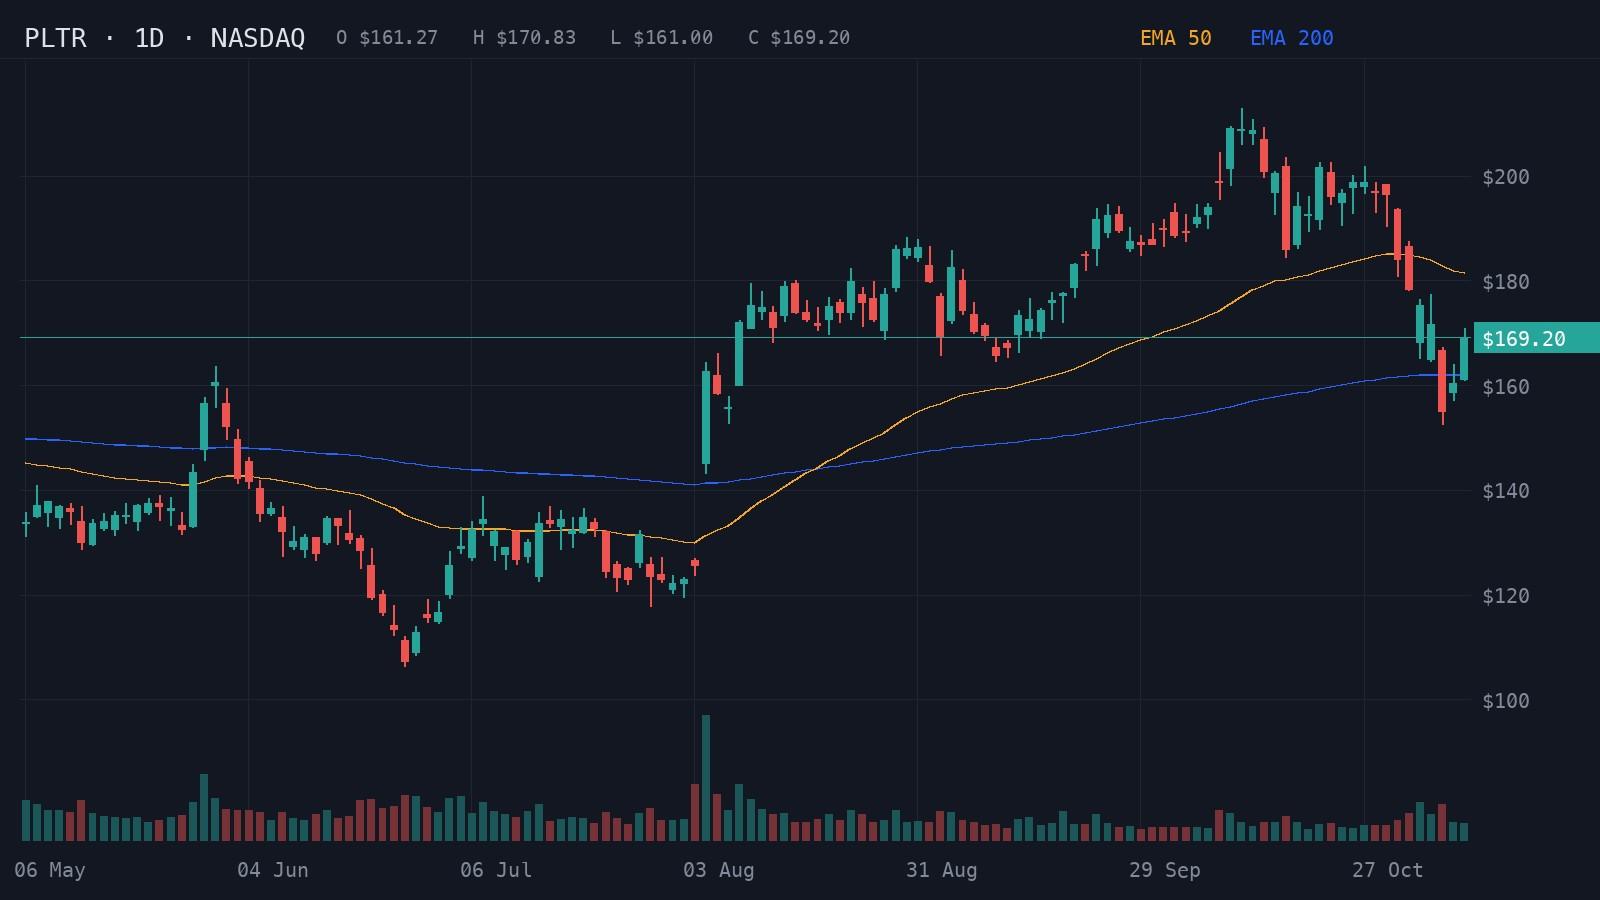
Here is Palantir's daily chart from May to the 9 November 2026 close. The stock climbed from about $107 on 25 June to almost $213 on 12 October, then rolled over. It gapped down on 3 November, fell 9.7% on 5 November to $154.99 and bounced 5.5% on 9 November to $169.20, which leaves it between its 50-day average near $182, now overhead, and its 200-day average near $162. Rather than prompt ChatGPT, we gave the screenshot to Wick.
- Resistance
- $180.00
- Support
- $160.00
- Stop loss
- $166.00
Price has fallen below the 50-day EMA and is testing the 200-day EMA after forming lower highs.
Indicators: EMA 50, EMA 200
A daily close above $180 could reclaim momentum toward $195.
- Entry
- >$180.00
- Target
- $195.00
- Stop
- $174.00
- R:R
- 1:2.5
A daily close below $160 could extend the markdown toward $150.
- Entry
- <$160.00
- Target
- $150.00
- Stop
- $166.00
- R:R
- 1:1.7
- Trigger
- Daily close below $160
- Entry
- Failed retest near $160
- Stop
- Above $166
- Target
- $150
Wick read a bearish pullback inside a downtrend with 68% confidence, leaning 58% to 42% toward the downside. The short waits for a daily close below $160, just under the 200-day average, then sells a failed retest with the stop above $166 and the target at $150: $6 a share at risk to make $10, about 1:1.7. The long needs a daily close back above $180, close to the 50-day average, and aims for $195 with a stop at $174.
With a $10,000 account and 1% risk, that $6 stop allows 16 shares: 100 ÷ 6 = 16.7, rounded down. That is the arithmetic Prompt 5 asks ChatGPT to show.
Everything Prompt 1 asks for is in the report, from the averages to both setups with their odds, and it took one upload.
No prompt needed for your next stock
Screenshot the stock in Robinhood, Webull, TradingView or your broker's app and send it to Wick. In seconds the same report appears for your own ticker, so the share count is the only thing left to work out before you place the order.
Prompt 2: the earnings check
Run this before you hold any stock through a quarterly report. It needs web search.
Search the web for [TICKER]'s next earnings date and how the stock reacted to its last four reports.

1. Give me the date, and whether the report comes before the open or after the close.
2. For each of the last four reports, how much did the stock move the next trading day, in percent?
3. If you can find it, what move is the options market pricing in for the next report?
4. Looking at the setup on my chart, would holding through the report put my stop at risk of being gapped? Answer yes or no, then explain in one sentence.
A stop is an order to sell at the next available price. If a stock opens 12% lower after earnings, the order fills down there, not at your stop. This prompt shows how big that risk usually is for the stock you're holding.
Prompt 3: a quick fundamental snapshot
Chart traders still want to know what they own. This prompt needs web search, and every figure should be checked against the company's latest quarterly filing.
Search the web and give me a one-screen snapshot of [COMPANY] ([TICKER]):

- What the company sells and where most of its revenue comes from
- Revenue growth and profit margin over the last four quarters
- Valuation: price-to-earnings and price-to-sales, next to two close competitors
- Cash, debt, and whether it is buying back shares or issuing new ones
- The three biggest risks analysts are pointing to right now
- Anything scheduled in the next 30 days that could move the stock

Cite the source and the date for every number. If a figure is older than the latest quarter, flag it.
Asking for a source and a date on each figure is the safeguard. ChatGPT can mix up quarters or quote numbers that are a year old, and the citation tells you exactly where to check.
Prompt 4: day trading a stock on the 5-minute chart
This is [TICKER] on the 5-minute chart since today's open. I day trade and close every position before 4 p.m. New York time.

1. Mark the opening range (the high and low of the first 30 minutes) and yesterday's close.
2. Is the stock holding above or below the opening range right now?
3. Give me one long and one short idea with entry, stop and target, keeping each stop under $[MAX STOP] a share.
4. If the breakout candle came on below-average volume, call the setup weak.
5. If nothing is clean, answer "stand aside" and name the level that would change your mind.
The opening range is the most watched intraday level in US stocks. Giving ChatGPT your exit time stops it from suggesting a target the stock has no time left to reach.
Prompt 5: how many shares to buy
My account is $[ACCOUNT] and I risk [RISK]% of it per trade. I want to [buy or short] [TICKER]: entry $[ENTRY], stop $[STOP], target $[TARGET].

Work out the dollar risk, the risk per share, the number of shares rounded down to a whole share, the total position value and the profit in dollars if the target is hit. Show the arithmetic, then warn me if the position value is more than [25]% of my account.
- Position size calculator for forex, gold, indices and stocksCalculate how many lots or shares to trade from your account size, risk per trade, entry and stop loss. Works for forex, gold, indices, crypto and stocks.
The warning at the end is a sanity check. A very tight stop can produce a share count that puts half your account into a single stock. The position size calculator gives the same answer without a chat.
Prompt 6: review a stock trade you closed
Attached are two screenshots of [TICKER]: one from when I entered and one from when I got out. I [bought or shorted] at $[ENTRY] with my stop at $[STOP] and my target at $[TARGET], and I closed it at $[EXIT] because [REASON].

Be blunt. Was my entry at a level that mattered, or in the middle of nowhere? Was I trading with the 50- and 200-day averages or against them? Did I ignore an earnings date or a market event? Give me one rule to add to my plan.
Run it on winners as well as losers. A trade that made money for the wrong reason builds a habit that costs money later.
Where ChatGPT trips up on stocks
- Stale data. Without web search, ChatGPT knows nothing after its training cutoff: no new earnings, no new prices. Even with search on, check its figures against the source.
- Splits. After a stock split, old levels and old analyst targets quoted in articles won't match the chart in front of you.
- Ticker mix-ups. Similar tickers and share classes, such as GOOG and GOOGL, get confused. Name the company as well as the ticker.
- Stock picking. Ask which stock will go up and you get a confident list built on nothing. Use ChatGPT to study a stock you already chose, not to choose one.
ChatGPT for the research, Wick for the chart
ChatGPT is good at the work around a stock trade: the earnings date, the fundamentals, the share count, the review afterwards. Reading the chart is where a dedicated tool wins. Wick turns one screenshot into the trend, the levels, a long and a short case with probabilities and a full plan, in the same layout for every ticker, and keeps each read in your journal.
The routine many stock traders end up with: Wick to read the chart, ChatGPT for earnings and fundamentals, and the position size calculator to set the share count.
Walk into the open with a plan
Every session, a stock on your watchlist reaches a level and you get a few seconds to decide. Make that decision before it gets there. Screenshot the chart, upload it to Wick, and know the level, the odds on each side and the close you need to see before you act. Download Wick and trade your watchlist with a plan, not a feeling.
Related guides
- How to analyze a stock chart with AIScreenshot any stock chart, upload it to an AI chart analysis app and read the trend, levels, scenarios and plan. With a real NVIDIA (NVDA) daily example.
- Tesla Stock Chart Analysis Today: TSLA Support and ResistanceWick's latest AI read of the Tesla (TSLA) chart: support and resistance, the bullish and bearish case with odds, and the level that decides the next move.
- Best apps for stock analysis with AI (2026)The best iPhone apps to analyze stocks in 2026: AI chart analysis, charting and research compared, from Wick and TradingView to Seeking Alpha and TipRanks.
Frequently asked questions
What is the best ChatGPT prompt for stock trading?
One that sends a screenshot of the stock's chart and asks for a fixed checklist: the price from the axis, its position against the 50- and 200-day averages, support and resistance, the next earnings date, and a long and a short setup with trigger, entry, stop, target and risk per share. Prompt 1 on this page is built that way.
Can ChatGPT pick stocks for me?
It will write a list, but not one worth trading on. It has no way of knowing which stocks will rise, and without web search its data is out of date. Use it to research and plan trades on stocks you have already chosen.
Can ChatGPT analyze a stock chart screenshot?
Yes. Upload a chart from TradingView, Robinhood, Webull or your broker and it describes the trend, levels and patterns. It can misread prices on the axis, so compare its levels with the chart. Wick does the same job with a fixed report and a trade plan on every upload.
Can ChatGPT do fundamental analysis of a stock?
With web search on, it can pull revenue, margins, valuation and risks into a short summary. Ask it to cite the source and date of every number, and check the important ones in the company's latest quarterly filing.
Is ChatGPT useful for day trading stocks?
For the preparation, yes: marking the opening range, listing levels and sizing the position. It cannot follow a live chart or see the price after your screenshot, so the decisions during the session are still yours.
Educational content, not financial advice. Trading involves risk, including the loss of your capital. AI analysis can be wrong; always do your own research. Read the full disclaimer.