
XAUUSD AI Analysis Today: Gold Chart Read
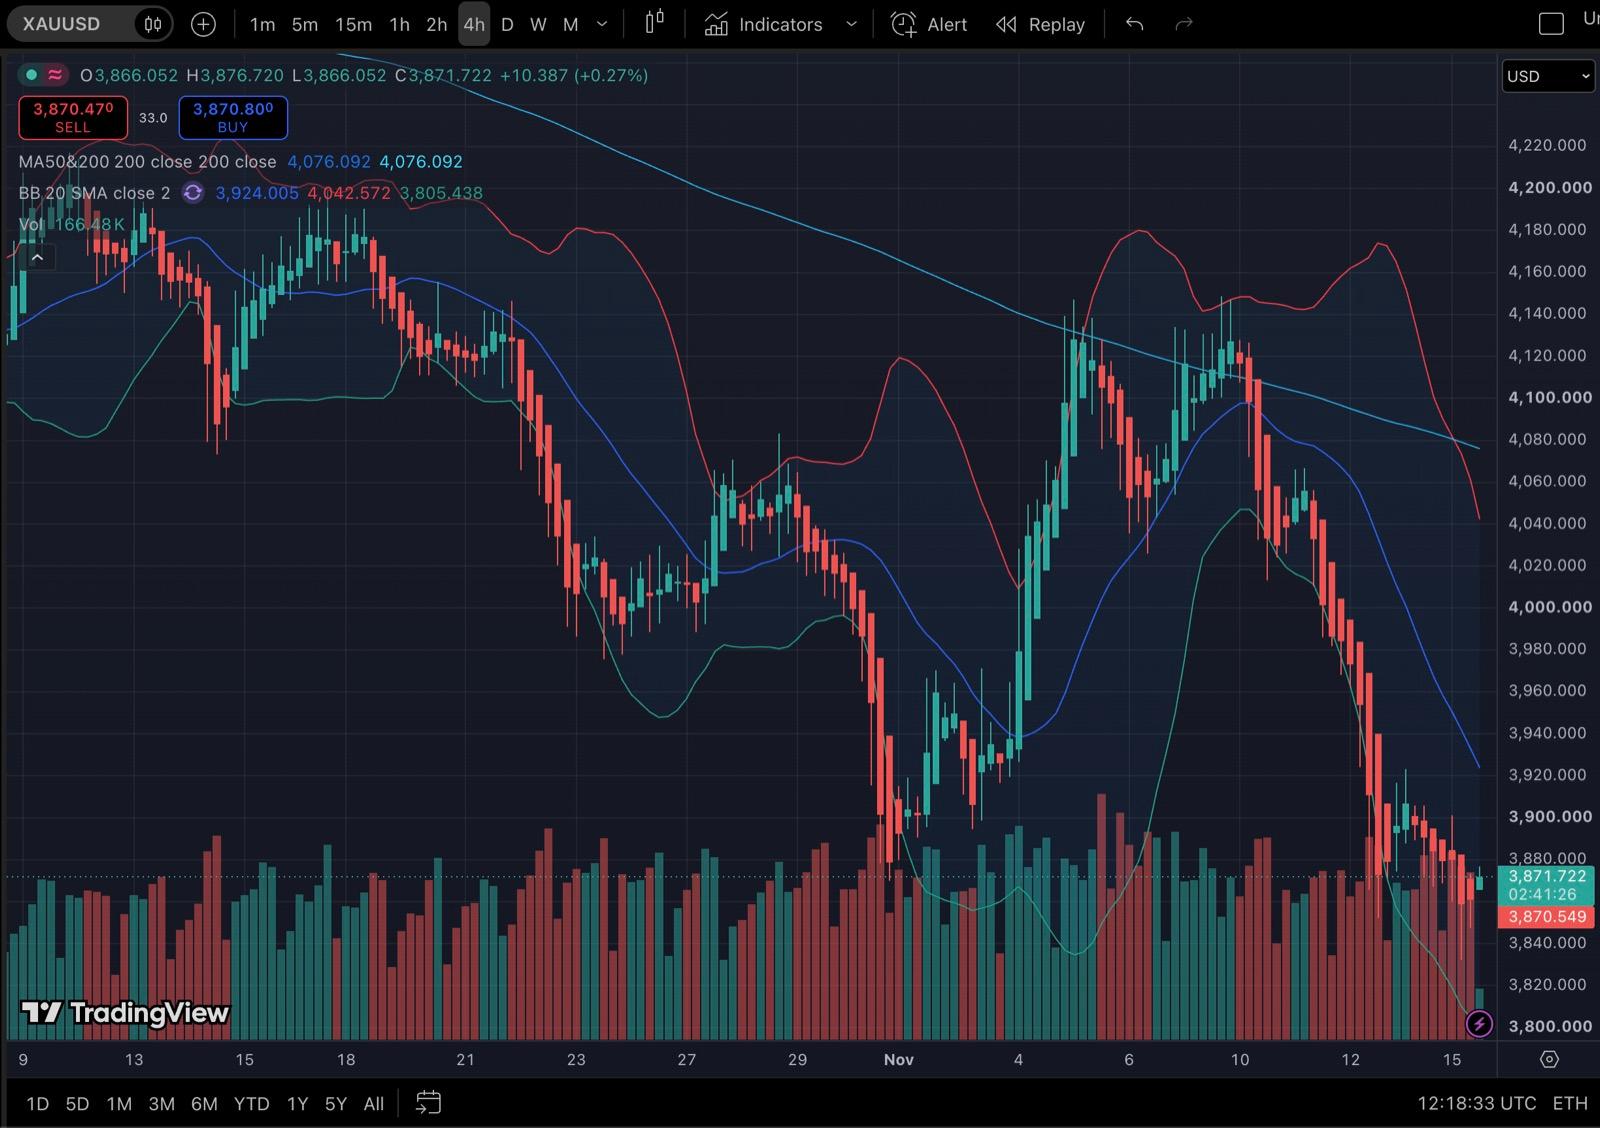
Wick's latest read of the gold (XAUUSD) 4-hour chart, from 16 November 2026 with gold at $3,872: a descending channel, 69% bearish at 78% confidence. The short goes live on a 4-hour close below $3,840, aiming for $3,750 with the stop above $3,900. The bullish case, at 31%, needs gold to win back $3,925 to open a rebound toward $4,040. Gold now trades nearly $280 below last Monday's high near $4,150, just above Monday morning's low near $3,830. Until one of those conditions is met, there is no trade. This page gets a fresh read several times a week.
Today's read: XAUUSD on the 4-hour chart, 16 November 2026
The slide kept going after Thursday's read. Gold broke below $3,900 on 12 November and found a floor near $3,850, bounced to about $3,925 on Friday, then dipped to about $3,830 early on Monday. When this TradingView screenshot was taken, at about 12:20 UTC on Monday, the chart showed $3,872. On the 4-hour chart the 200-period moving average sits far above at $4,076, and the Bollinger Bands span $3,805 to $4,043, with the middle band at $3,924.
- Resistance
- $3,900.00
- Support
- $3,840.00
- Stop loss
- $3,900.00
Lower highs and lower lows favor continued selling while price remains below $3,900.
Indicators: MA50/200, Bollinger Bands, volume
A sustained reclaim above $3,925 could open a move toward $4,040.
- Entry
- >$3,925.00
- Target
- $4,040.00
- Stop
- $3,890.00
- R:R
- 1:3.3
A clean break below $3,840 could extend the decline toward $3,750.
- Entry
- <$3,840.00
- Target
- $3,750.00
- Stop
- $3,900.00
- R:R
- 1:1.5
- Trigger
- 4H close below $3,840
- Entry
- Failed retest near $3,840
- Stop
- Above $3,900
- Target
- $3,750
Wick reads it as a descending channel. The 10 November rebound to $4,150 failed under the 200-period average, and every bounce since has topped out lower: about $4,065 on 11 November, then $3,925 on Friday. It calls the market phase markdown and the risk high, with volume rising into the drop.
The bearish plan needs a 4-hour close below $3,840, then sells a failed retest of that level with the stop above $3,900 and the target at $3,750: $60 of risk for $90 of reward, about 1:1.5. The bullish case needs gold to win back $3,925, the middle band, with a stop at $3,890 and a target of $4,040, just under the upper band. At $3,872 gold sits $32 above the bearish trigger and $53 below the bullish one.
Key gold levels on the 4-hour chart right now
From the top of the chart down, these are the prices that matter in this read:
- $4,150, where the 10 November rebound topped out.
- $4,076, the 200-period moving average. It is falling, and as long as gold trades under it the trend on this chart points down.
- $4,043 and $4,040, the upper Bollinger Band and Wick's bullish target.
- $4,000, the round number. Gold lost it on 11 November.
- $3,925, the middle band, Friday's bounce high and Wick's bullish trigger. Winning it back is what would turn the read.
- $3,900, the old support gold broke on 12 November, now resistance and the stop for the bearish plan.
- $3,890, the stop for the bullish case.
- $3,850, Thursday's low.
- $3,840, support and Wick's bearish trigger. A 4-hour close below it reopens the slide.
- $3,830, Monday's low so far.
- $3,805, the lower Bollinger Band.
- $3,750, the bearish target.
What to watch next
- The 4-hour close, not intraday spikes. The bearish trigger is a candle close, so a wick through $3,840 that closes back above it does not count, and the bullish case needs gold to hold above $3,925, not just touch it.
- Monday's low near $3,830 and the lower band at $3,805. Gold is testing the floor of its slide, and a 4-hour close below $3,840 is the line Wick is waiting for.
- US data. Inflation, payrolls and Fed decisions can push gold through either level in minutes. Check the calendar before acting on any read.
- The New York morning. Gold's biggest hourly moves cluster between 8 and 11 a.m. New York time, when a breakout is most likely to start.
- Best Time to Trade Gold (XAUUSD): Trading Hours by Time ZoneThe best time to trade gold is 8 to 11 a.m. New York time. See when gold moves most, with real hourly data and the hours in India, Pakistan, the UAE and more.
Get this read on the gold chart you trade
This page shows one chart. Your trade lives on your own timeframe, from the 5-minute scalp to the weekly swing. Take a screenshot of XAUUSD in MetaTrader or TradingView and send it to Wick. Within seconds you know where support and resistance sit, which side has the edge and by how much, and which candle close you are waiting for.
Recent reads that hit their target
On 6 November, with gold at $4,065, Wick read the 4-hour chart as a descending channel and leaned short at 63%. Its plan waited for a 4-hour close below $4,000, put the stop above $4,040 and aimed for $3,940. Gold finished a 4-hour candle under $4,000 on the evening of 11 November and touched $3,940 the next morning. That read is the worked example in the gold guide.
On the morning of 6 November, with gold at $4,065, Wick saw a pullback in a rising market on the hourly chart and leaned long at 58%. Its plan needed an hourly candle to finish above $4,080 before buying, risked down to $4,055 and aimed for $4,125. Gold closed above $4,080 early on 9 November and reached $4,125 within about an hour, on its way to Monday's $4,134 high. That read is the worked example in the main guide.
- How to analyze a gold (XAUUSD) chart with AIScreenshot your XAUUSD chart, upload it to an AI chart analysis app, and read the trend, key levels, scenarios and trade plan it returns. A real example.
- AI Chart Analysis: How to Analyze a Trading Chart with AIHow AI chart analysis works: screenshot any trading chart, upload it, and read the trend, key levels, both scenarios and a trade plan. With real examples.
Not a signal, not a prediction
People searching for gold AI often want one of three things:
- An XAUUSD AI signal, a buy or sell call. Wick does not send one. It shows the levels and the condition that has to happen first, and the decision stays yours.
- An XAUUSD AI prediction for today, a price gold will hit. No model can know that, because gold reacts to news no chart contains.
- A buy-or-sell answer for today. The honest answer is conditional, and the read above spells it out: a 4-hour close below $3,840 turns on the bearish case, winning back $3,925 the bullish one, and in between there is no trade.
What you get instead is an analysis you can check: the trend, the levels, the odds on each side and the price where each idea is wrong. Every read explains its reasoning, so you learn to see the setup yourself.
Read your own XAUUSD chart step by step
The gold guide walks through the whole process, from taking a good screenshot to reading every part of the report, with two more real examples on the 4-hour and 1-hour charts.
- How to analyze a gold (XAUUSD) chart with AIScreenshot your XAUUSD chart, upload it to an AI chart analysis app, and read the trend, key levels, scenarios and trade plan it returns. A real example.
- XAUUSD Lot Size Calculator: Gold Position Size and Lot ValueWork out your gold (XAUUSD) lot size from your account, risk, entry and stop, plus what 0.01, 0.02 and 0.1 lots are worth per $1 move, with worked examples.
Stop guessing: get today's read on your own gold chart
The read on this page is a few days old by the time you act on it. The one on your screen is live. Pull up XAUUSD on your trading timeframe, take a screenshot and hand it to Wick: the levels, the odds on each side and the exact close that turns an idea into a trade come straight back. Download Wick and stop trading gold on a hunch.
Related guides
- Best AI apps for gold (XAUUSD) trading in 2026The best iPhone apps for trading gold in 2026: AI analysis of XAUUSD charts, MetaTrader 5, TradingView, the economic calendar and gold news, compared.
- Best ChatGPT prompts for gold (XAUUSD) tradingCopy-ready ChatGPT prompts for gold (XAUUSD) trading: chart analysis, scalping, lot size, the US data calendar and trade reviews, with a real example.
- Best Time to Trade Gold (XAUUSD): Trading Hours by Time ZoneThe best time to trade gold is 8 to 11 a.m. New York time. See when gold moves most, with real hourly data and the hours in India, Pakistan, the UAE and more.
Frequently asked questions
What is today's XAUUSD AI analysis?
Wick's latest read, from 16 November 2026, sees gold in a descending channel on the 4-hour chart, 69% bearish at 78% confidence. The bearish plan needs a 4-hour close below $3,840, aiming for $3,750; the bullish case needs gold to win back $3,925, aiming for $4,040. Between those levels there is no trade.
Is this an XAUUSD trading signal?
No. A signal says buy or sell and stops there. Each read here is educational: key levels, a bullish and a bearish case with rough odds, the candle close each one needs, and the price where it fails. The judgment is left to you.
Can AI predict the gold price today?
No. Gold moves on news, data and flows that no chart shows, so nobody can reliably predict where it will trade. Chart analysis offers something narrower and more useful: the conditions under which gold would likely rise or fall, with rough odds for each.
Should I buy or sell gold today?
That decision is yours, and nothing here is financial advice. The current read is conditional: a 4-hour close below $3,840 would favor the bearish case, a move back above $3,925 the bullish one, and in between it suggests waiting. Check the economic calendar and size any trade with the XAUUSD lot size calculator.
How often is this page updated?
Several times a week. Each read is dated, taken from a real TradingView screenshot, and run through Wick as it is.
Educational content, not financial advice. Trading involves risk, including the loss of your capital. AI analysis can be wrong; always do your own research. Read the full disclaimer.