
Tesla Stock Chart Analysis Today: TSLA Support and Resistance
Tesla (TSLA) closed at $390.22 on Friday 13 November 2026 after touching $404.40, and Wick's newest AI read of its daily chart sees a rounded recovery inside its $350 to $410 range. The bullish case leads, 57% to 43% at 63% confidence. A daily close above $410 would point to $430, with the stop below $398; a break below $350 would expose $327.50. On the 1-hour chart Tesla is boxed between $386 and $396, and an hourly close above $396 would aim for $411. Last week, two of Wick's Tesla reads reached their targets, at $400 and $402. The read is refreshed a few times each week.
Today's read: TSLA on the daily chart
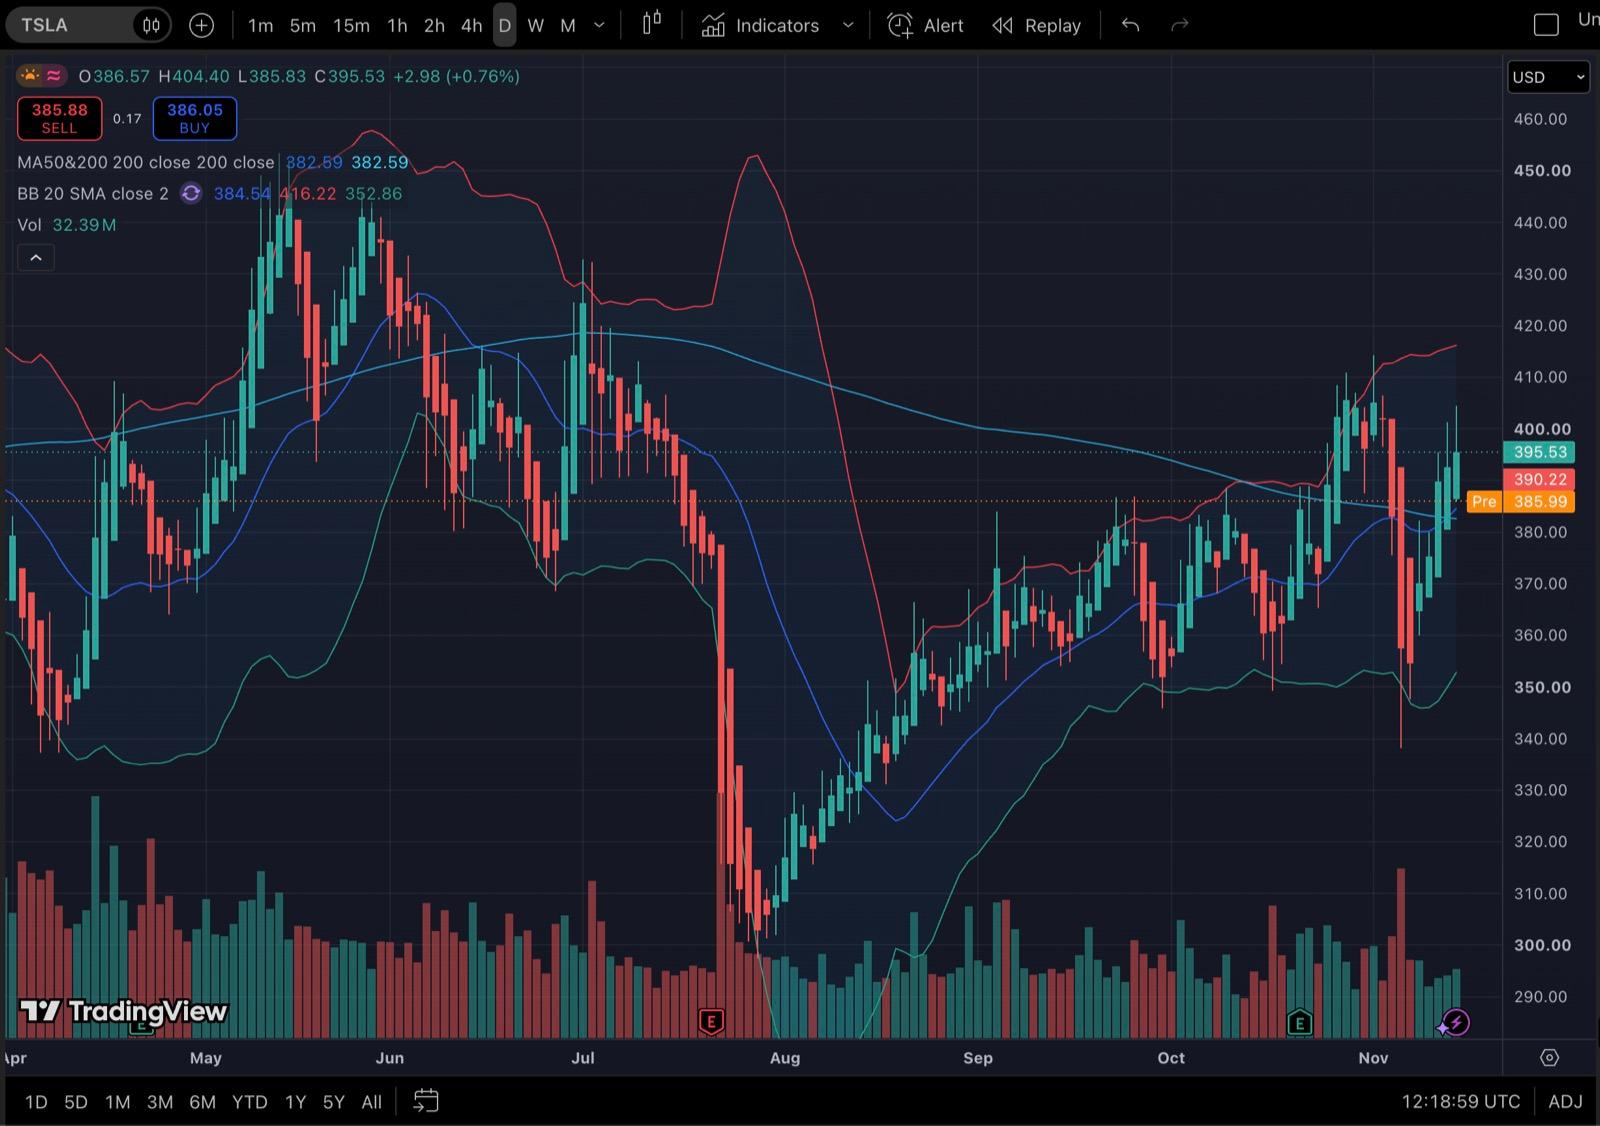
Tesla pushed through $400 last week, twice. After closing above $375 on Monday 9 November, it reached $401.22 on Thursday and $404.40 in Friday's first minutes, then gave the gains back to close Friday at $390.22. Before Monday's open it traded near $386. It still sits above the 200-day moving average at $383 and the middle Bollinger Band at $385, with the upper band at $416 and the 2 November high at $414 overhead.
- Resistance
- $410.00
- Support
- $350.00
- Stop loss
- $398.00
Price is recovering within a broad range, but resistance near $410 remains unresolved.
Indicators: MA50, MA200, Bollinger Bands, volume
A daily close above $410 could open a move toward $430.
- Entry
- >$410.00
- Target
- $430.00
- Stop
- $398.00
- R:R
- 1:1.7
A breakdown below $350 could expose the $327.50 area.
- Entry
- <$350.00
- Target
- $327.50
- Stop
- $365.00
- R:R
- 1:1.5
- Trigger
- Daily close above $410
- Entry
- Successful retest near $410
- Stop
- Below $398
- Target
- $430
Wick reads it as a rounded recovery inside the same range. Tesla has traded between roughly $350 and $410 since September, and the climb from the early-November low has curved back toward the top of it. It calls the trend sideways, the market phase accumulation and the risk medium.
The plan stays long and still waits for a daily close above $410. Then it buys a successful retest of that level, puts the stop below $398 and targets $430: $12 of risk for $20 of reward, about 1:1.7. The bearish case needs a break below $350, with $327.50 as the target. At Friday's close, Tesla sits about $20 below the bullish trigger.
Short-term read: TSLA on the 1-hour chart
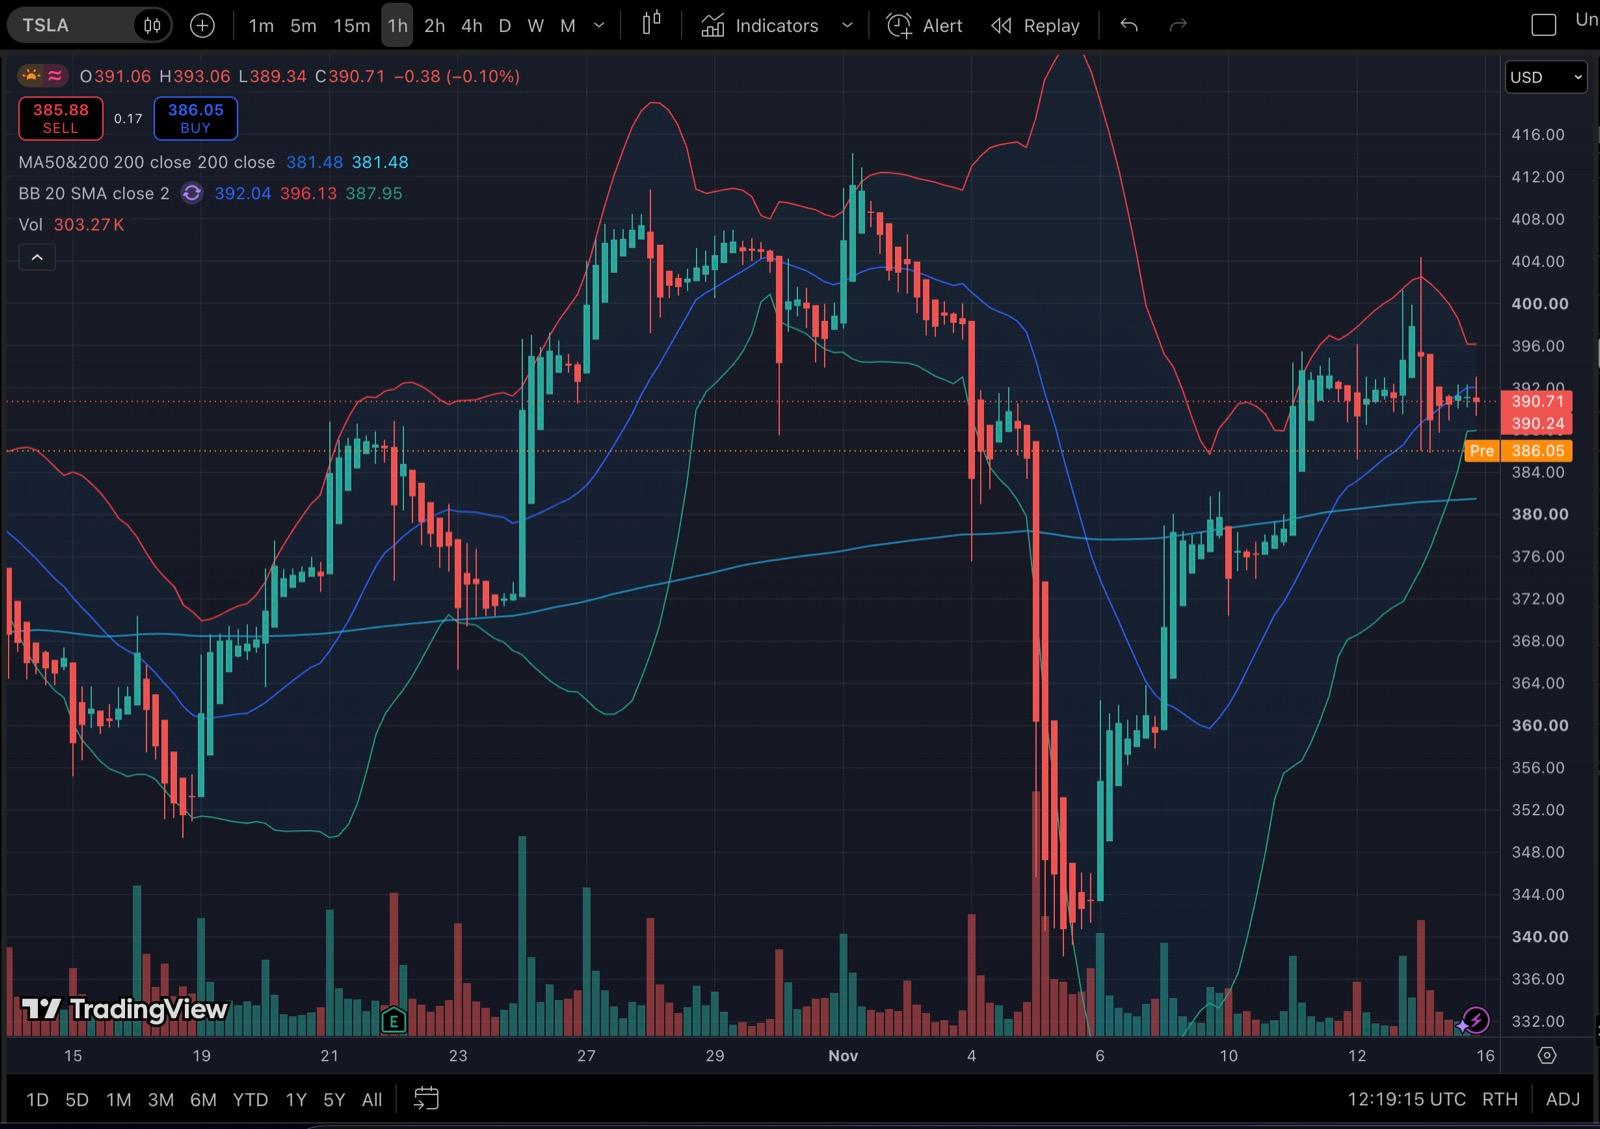
For day traders, here is the hourly chart of regular trading hours since mid-October, with last week's spikes above $400 and Friday's pullback in detail.
- Resistance
- $396.00
- Support
- $386.00
- Stop loss
- $391.00
Price is consolidating between roughly $386 and $396 after a sharp recovery.
Indicators: MA50, MA200, Bollinger Bands, volume
A confirmed breakout above $396 could target the prior resistance zone near $411.
- Entry
- >$396.00
- Target
- $411.00
- Stop
- $391.00
- R:R
- 1:3
A breakdown below $386 could expose the rising average near $381, then the $370 area.
- Entry
- <$386.00
- Target
- $370.00
- Stop
- $390.00
- R:R
- 1:4
- Trigger
- 1H close above $396
- Entry
- Successful retest near $396
- Stop
- Below $391
- Target
- $411
On the hourly chart Wick sees a rectangle: since Wednesday, Tesla has spent its hours between about $386 and $396, and the spikes to $401 on Thursday and $404 on Friday didn't hold. It leans bullish at 58%, with 72% confidence. The long needs an hourly close above $396, then buys the retest with the stop below $391 and the target at $411: $5 of risk for $15 of reward, about 1:3. A break under $386 would expose the rising 200-hour average near $381, then $370.
Both charts lean long. The hourly trigger at $396 comes first, and its $411 target sits right at $410, the daily trigger and the bigger test.
Tesla support and resistance levels
Highest to lowest, the Tesla prices that matter this week:
- $498.83, the 52-week high, set on 22 December 2025.
- $430, the daily bullish target.
- $416 and $414, the upper Bollinger Band and the 2 November high.
- $410 and $411, the top of the range and Wick's daily trigger, with the hourly target just above. A daily close over $410 is what would turn the range into a breakout.
- $404.40, Friday's high, where the push above $400 stalled.
- $398, the stop for the daily long.
- $396, the top of the hourly rectangle and the hourly trigger.
- $391, the stop for the hourly long.
- $386, hourly support at the bottom of the rectangle, where Tesla traded before Monday's open.
- $385 and $383, the middle Bollinger Band and the 200-day average.
- $381, the 200-hour average on the hourly chart.
- $370, the hourly bearish target.
- $350, range support and the daily bearish trigger.
- $327.50, the daily bearish target.
- $297.38, the 52-week low, set on 29 July 2026.
What to watch next
- The close, not the intraday swings. Both of Wick's triggers are candle closes, and Tesla often wicks through levels during the session.
- The opening and closing hour of US trading, 9:30 to 10:30 a.m. and 3 to 4 p.m. New York time. Tesla trades the most volume then, and big moves usually start in those windows.
- Tesla headlines. Delivery numbers, usually published in the first days of a new quarter, and earnings move the stock far more than any chart pattern.
- The wider market. Tesla tends to move harder than the Nasdaq 100 in both directions, so a strong index makes a break of $410 more likely, and a weak one can send it back toward $350.
Get this read on any stock you trade
Tesla is one chart. The stock you are watching right now is another. Screenshot it in your broker's app, Robinhood, Webull or TradingView, upload it to Wick, and within seconds you know its support and resistance, which way the odds lean and the close that has to happen before you buy or sell.
Recent reads that hit their target
On 6 November, with Tesla at $358, Wick's hourly read gave the rebound a 36% chance and set its terms: a push above $365 could extend the bounce toward $380. Tesla opened Monday 9 November above $365 and reached $380.08 within the first two hours of trading.
Wick's daily read from the same day gave the rebound 42%: a move back above $375 could carry Tesla to the $400 area, with the stop at $365. Tesla closed at $378.05 on 9 November, stayed well clear of the stop, and traded at $401.22 on Thursday 12 November.
On 12 November, the hourly read saw a bullish flag under $395 and leaned long at 56%: an hourly close above $395, a stop below $391.50 and a target of $402. Tesla finished an hourly candle at $397.89 that Thursday afternoon, and on Friday it ran to $404.40 in the first five minutes of the session, through the target.
Not a price prediction
Searches for Tesla and AI often ask for a price prediction for today. Here is what a chart read can and cannot tell you:
- It cannot tell you where Tesla closes today. The stock moves on news, deliveries and Elon Musk headlines that no chart contains.
- It can tell you which levels matter, which side the chart favors and by how much, and the exact close that would confirm each side.
- It cannot tell you whether to buy or sell. It works in if-then terms: a close over $410 switches on the long case, a break under $350 the short case, and anything between means waiting.
That is more useful than a single price target, because it tells you what to do in both cases and where you are wrong.
Read any stock chart with AI
The stock chart guide covers what makes stock charts different, from gaps and earnings to volume and the 50- and 200-day averages, with a full NVIDIA example. The apps roundup compares Wick with the other tools stock traders use.
- How to analyze a stock chart with AIScreenshot any stock chart, upload it to an AI chart analysis app and read the trend, levels, scenarios and plan. With a real NVIDIA (NVDA) daily example.
- Best apps for stock analysis with AI (2026)The best iPhone apps to analyze stocks in 2026: AI chart analysis, charting and research compared, from Wick and TradingView to Seeking Alpha and TipRanks.
Stop guessing: read your next stock chart with Wick
Every Tesla trader sees the same candles. The edge is knowing the plan before the open: the level, the odds, the close to wait for and the price where you are wrong. Screenshot the chart you trade, send it to Wick and walk into the session with a plan instead of a hunch. Download Wick before the next bell.
Related guides
- Best ChatGPT prompts for stock trading and analysisCopy-ready ChatGPT prompts for stock trading: chart reads, earnings checks, fundamentals, day trading, share sizing and trade reviews, with a real PLTR example.
- Position size calculator for forex, gold, indices and stocksCalculate how many lots or shares to trade from your account size, risk per trade, entry and stop loss. Works for forex, gold, indices, crypto and stocks.
- Entry, stop loss and target: how to read a trade planWhat the trigger, entry, stop loss, target and risk-reward ratio mean in a trade plan, with a worked gold example and the arithmetic behind 1:1.5.
Frequently asked questions
What is Tesla's stock chart showing today?
As of the 13 November 2026 close at $390.22, Wick reads TSLA's daily chart as a rounded recovery inside a $350 to $410 range. The bullish case leads 57% to 43%: a daily close above $410 would point to $430, and the 1-hour chart shows a rectangle between $386 and $396.
What are Tesla's support and resistance levels right now?
Support is $386 on the hourly chart, then the 200-day average near $383 and range support at $350 on the daily. Resistance is $396 on the hourly chart, then Friday's high at $404.40, $410 and the 2 November high at $414, with $430 above.
Is TSLA a buy or a sell today?
Wick doesn't make that call for you, and this page is not financial advice. What the chart says: a day ending above $410 favors a run toward $430, a break below $350 favors a drop toward $327.50, and while Tesla trades between them, sitting out is the plan.
Can AI predict Tesla's stock price?
No. A chart can't see Tesla's next delivery report, earnings surprise or headline, and those drive the stock, so its price can't be forecast reliably. An AI chart read lays out the levels and the conditions for a move up or down, with rough odds for each.
When does this TSLA read change?
A few times a week. Every update carries its date, and both charts, daily and hourly, go into Wick unedited.
Educational content, not financial advice. Trading involves risk, including the loss of your capital. AI analysis can be wrong; always do your own research. Read the full disclaimer.